Biotech iQ Recap for the Week Ending June 6, 2025
Welcome to the BiQ Weekly Recap #20!
If you are a new BiQ Free or Premium subscriber, remember to join the BiQ Chat server on Discord. Click here for more information. Also, please read the Getting Started article for more information on the tools and services offered at BiQ.
Weekly Overview
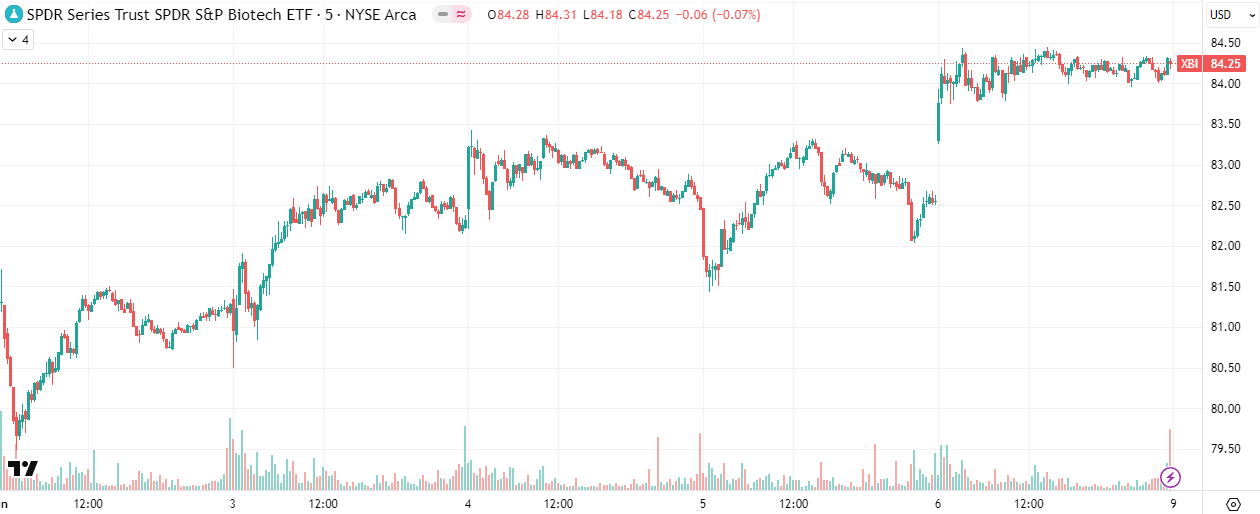
The index closed last Friday at 79.16, opened Monday at 80.20, and closed Friday at 84.25 for a weekly gain of 6.4%. It reached an intra-week high of 84.45 and a low of 79.49 for an intra-week range of 6.2%.
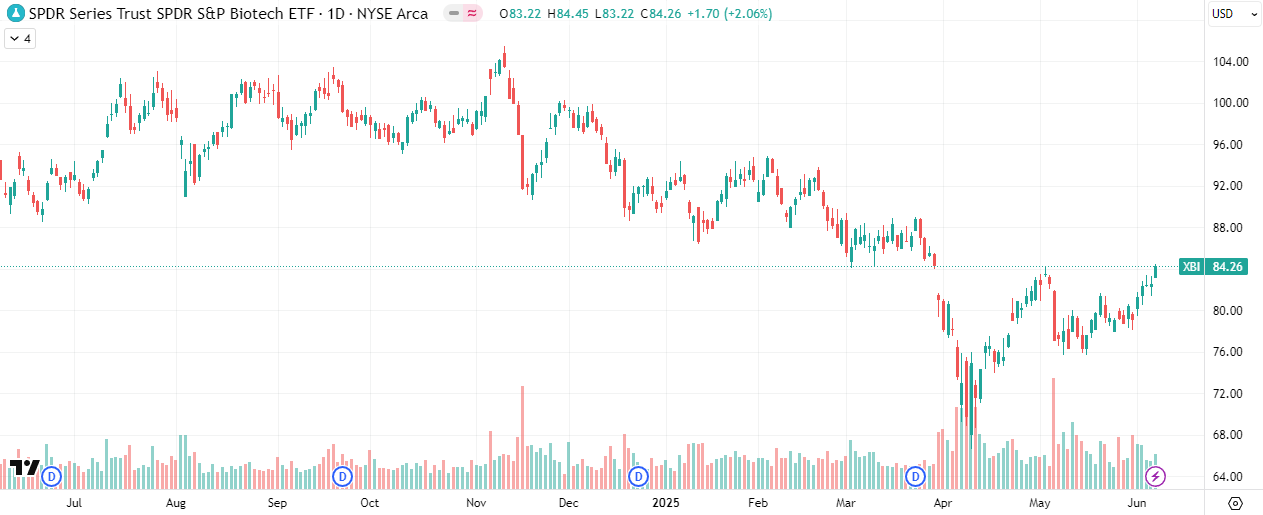
Zooming out to the one-year chart, we can see that the index closed Friday at a key resistance level, and it will be very interesting to see where the index goes from here. I believe markets still face significant headwinds from ongoing trade negotiations, ongoing uncertainty regarding the future direction of the FDA, and the potential fallout from MFN. We still have a long way to go before we're clear of these headwinds, and it will take time to work through these uncertainties. I continue to maintain elevated liquidity levels and aggressively sell Call options while waiting for the index to find its footing.
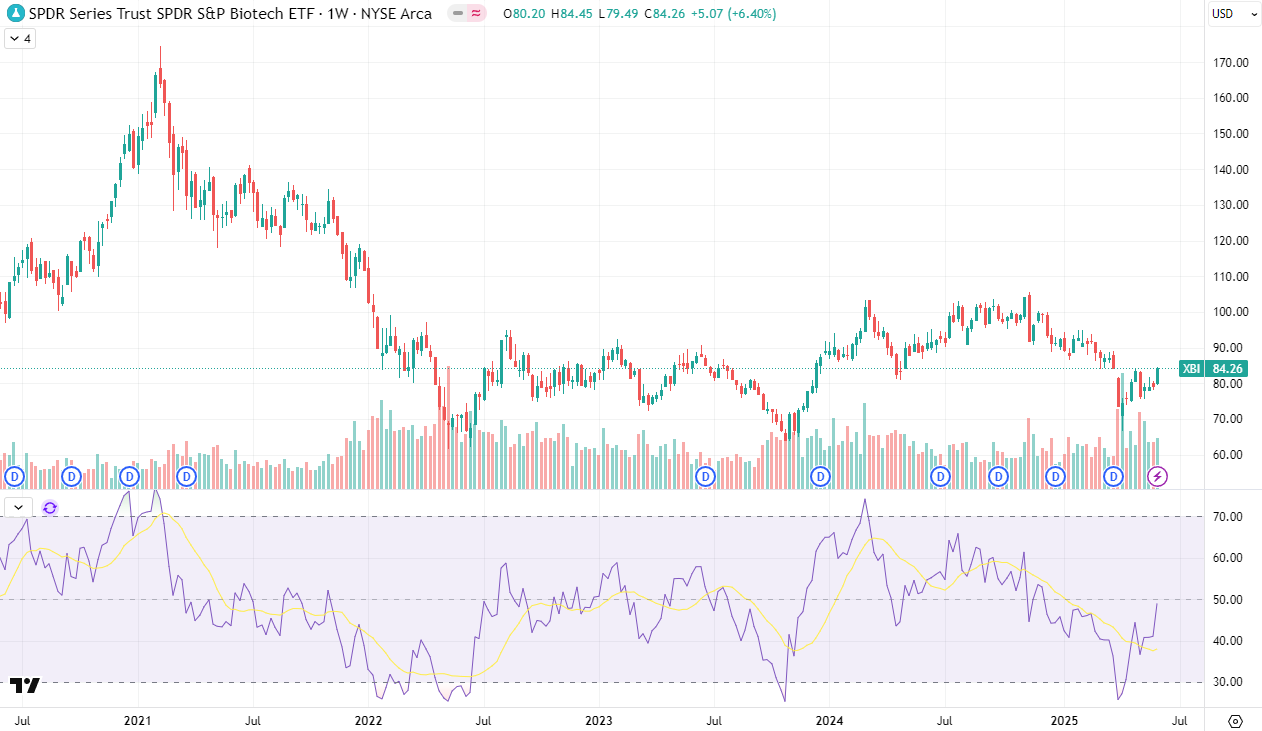
Zooming out further to the five-year chart, we can see that the index has bounced off the 64 to 66 level three times: in June 2022, October 2023, and most recently in April 2025. While I am cautiously hopeful that we may see a recovery to the 88-90 resistance level, volatility remains elevated, and it's equally possible the index revisits recent lows. It's tough to make any predictions, so my portfolio positioning remains cautious.
BiQ Service Updates
- No BiQ service updates.
BiQ Realized Gains & Losses
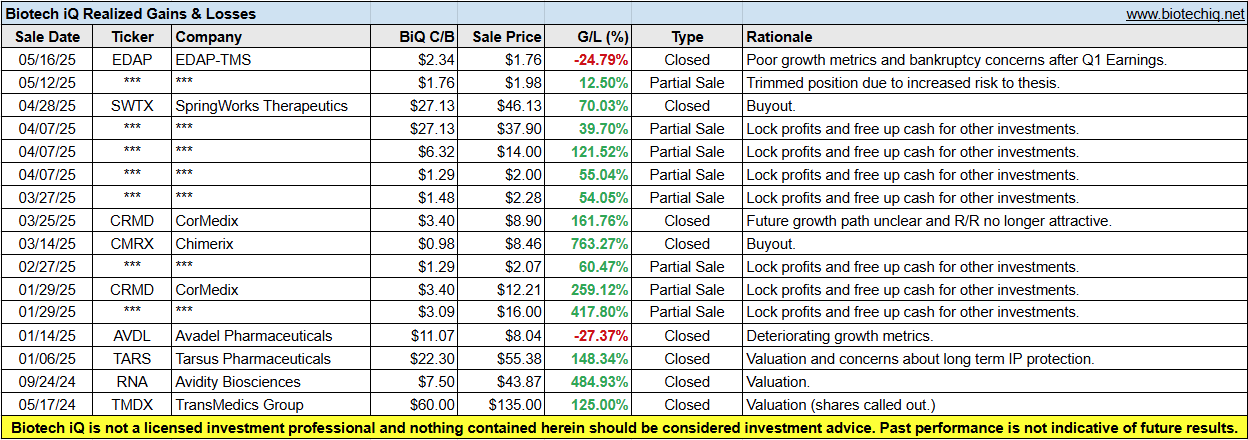
Biotech iQ is oriented towards long-term investing; it is not a short-term or active trading service. Typically, I only fully exit positions when the long-term thesis and risk/reward no longer appear attractive. The BiQ Realized Gains & Losses spreadsheet displays all realized gains and losses since BiQ was launched in 2024. Premium members can also view the current performance of the BiQ Active Portfolio on the Active Portfolio page of the Biotech iQ website.
BiQ Premium Membership Promotions
For subscribers interested in a Premium membership to Biotech iQ, I am now offering three promotions for new subscribers:
- 50% Off your First year: https://www.biotechiq.net/50-off-your-first-year
- 20% Off for Life: https://www.biotechiq.net/20-off-for-life
- Try 1 Month of BiQ Premium for $10: https://www.biotechiq.net/first-month-for-10
Click here for more information about Biotech iQ, and to see what's included in a Premium membership, or please visit www.biotechiq.net. Promotional offers can be used only once, and only one promotional offer can be used per subscriber.
Thank you for subscribing to Biotech iQ and reading this Weekly Recap. Premium Members can continue reading below.